Canada’s cannabis retailers reached a new monthly sales high in August, according to David Brown’s October 23 reporting for StratCann. The reported C$520.4 million total offers an encouraging snapshot of legal retail spending. It also arrives with a reminder for anyone following cannabis numbers: the month being measured, the date of release and the kind of measurement all matter.
This is an August sales story released in October, rather than a measure of what shoppers are spending this week. It is also a national total, which can conceal very different experiences for individual stores, producers and provinces. A record at the cash register does not automatically translate into stronger margins throughout the supply chain.
A record with a revised comparison
StratCann reports that the preliminary August figure was about 3% above the comparable August 2025 total. Its coverage also notes an upward revision to July 2026, from C$503.2 million to C$515.8 million. That revised baseline makes the monthly increase look considerably smaller than a comparison using the older July number would suggest.
The provincial picture was uneven. Brown reports that Alberta declined year over year, while Manitoba recorded the strongest annual percentage increase. Ontario, the largest provincial market by sales, grew by less than 1%. Those differences make a national record a starting point for understanding the market, rather than a description of every local business.
The underlying official series is Statistics Canada’s monthly retail trade table, released October 23. The figures cited here are attributed to StratCann’s reading of that release; the interactive table’s cannabis values were not independently retrievable during our review.
Why revisions belong in the story
Statistics Canada’s Monthly Retail Trade Survey methodology explains that the agency collects information from retailers and administrative records. When actual data are not available during collection, respondents’ estimates can be accepted and revised later. This gives readers a practical reason to check the latest version of a series before making comparisons.
The survey measures monthly retail activity across a changing business population. Its documentation describes sampling, checks for inconsistent responses and estimation for missing information. A release is therefore a statistical estimate with a reference period, rather than an immutable tally that never changes after publication.
For cannabis operators, the useful habit is straightforward: save the release date alongside the number. When comparing two months, use values drawn from the same current version of the series where possible. Otherwise, an apparent jump can partly reflect a stale baseline rather than a sudden change in demand.
Sales dollars and product units answer different questions
A second official source, Health Canada’s cannabis market data, describes what the legal industry sells in packaged units. Its latest displayed product figures cover June 2026, not August. They should not be treated as the product breakdown of the newer retail-dollar record.
For June, dried cannabis accounted for 50% of combined medical and non-medical unit sales, with edibles at 26% and extracts at 23%. These are shares of units, not shares of retail revenue, grams consumed or individual customers. A package of flower and an edible package count as units without necessarily carrying the same price or quantity.
Health Canada also cautions that its information is revised as validation continues, and that it generally does not estimate reports that have not been submitted, except in rare cases. That limitation matters when placing its inventory and sales figures alongside a separate retail survey. The two sources illuminate different parts of the market.
What the record means for readers
For shoppers, the record is evidence of substantial spending in the legal retail channel. It does not establish that cannabis has become cheaper, that every province offers the same selection or that every producer is benefiting equally. Those questions require price, assortment and company-level evidence beyond a national sales total.
The distinction also applies when reading individual business updates, such as Bountiful Farms’ recent retail growth report. A company’s quarterly comparison and a country’s monthly retail series describe different periods and populations. They can provide context for one another without being interchangeable benchmarks.
August’s reported record is worth following. The more useful next step is to watch whether gains persist after revisions and across regions, while keeping dollar sales separate from product-unit measures. That approach gives the headline some substance without asking a single monthly number to explain the entire Canadian cannabis economy.
Keeping a simple reading checklist helps: identify the currency, reference month, release date and whether the measure counts dollars or units. Then check whether the comparison month was revised. Those basic details make a sales headline more useful to someone assessing the market, without assuming a record means every part of the industry is thriving.
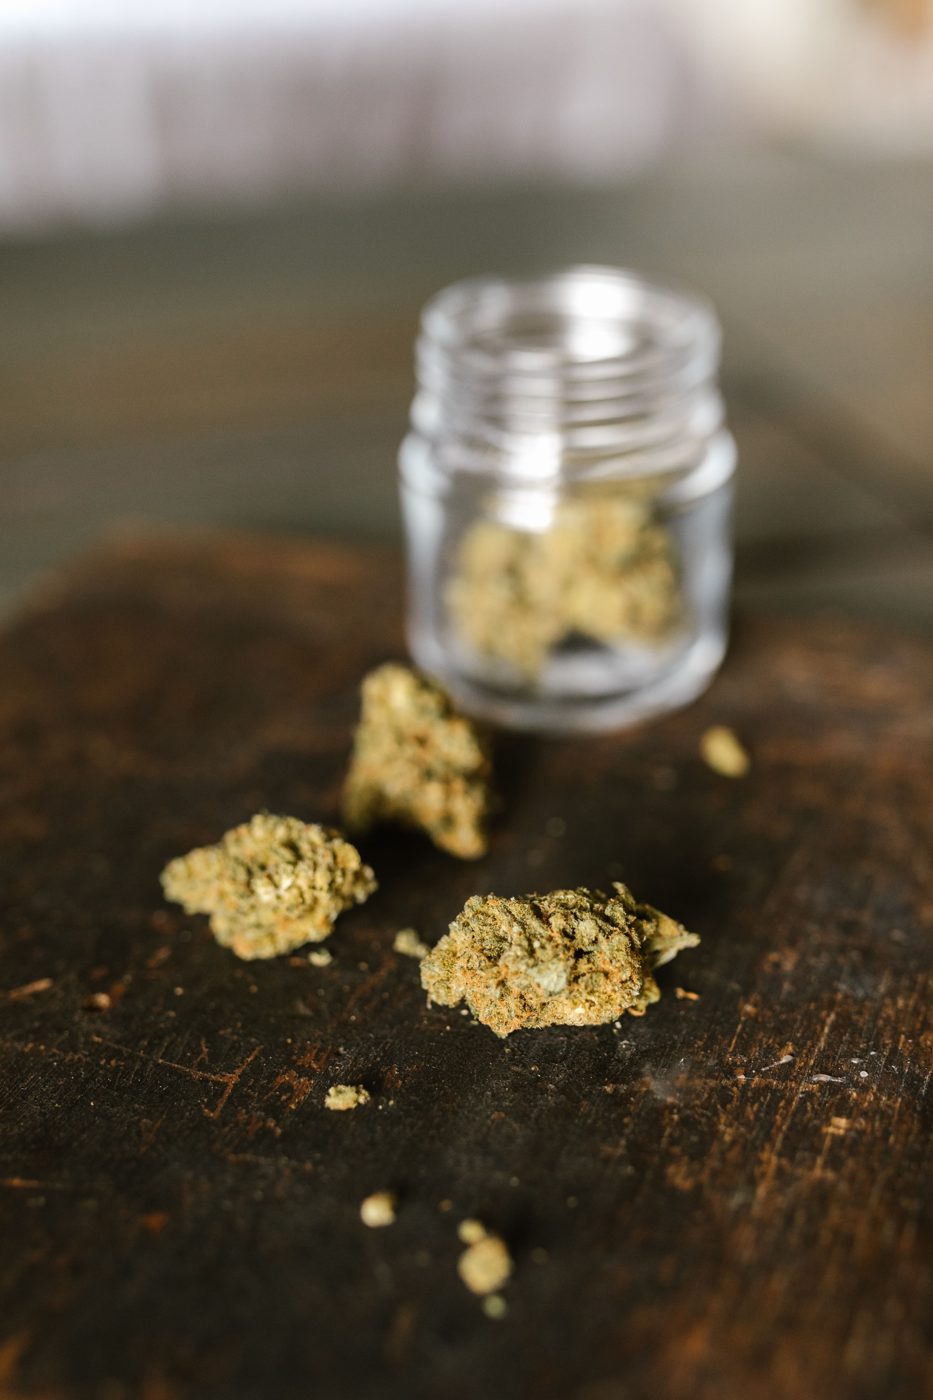
Illustrative stock retail photograph; not an identified Canadian retailer. Photo: Lucas Porras / Pexels.





 Cannabis4 days ago

 Cannabis4 days ago


 Cannabis3 days ago

 Cannabis3 days ago

 Products3 days ago

 Cannabis2 days ago

 Cannabis2 days ago